 As we embarked on the grueling task of compiling our industry statistics for 2021, I was probably more intrigued than ever as to what the final results would be. Anecdotally, we heard all year that everyone was doing well despite all the headwinds: supply chain disruptions, a gazillion price increases, inventory backlogs, record inflation and more. But on the flip side, consumers still exhibited a willingness to spend on their homes. Many continued to relocate and as such retailers posted record years.
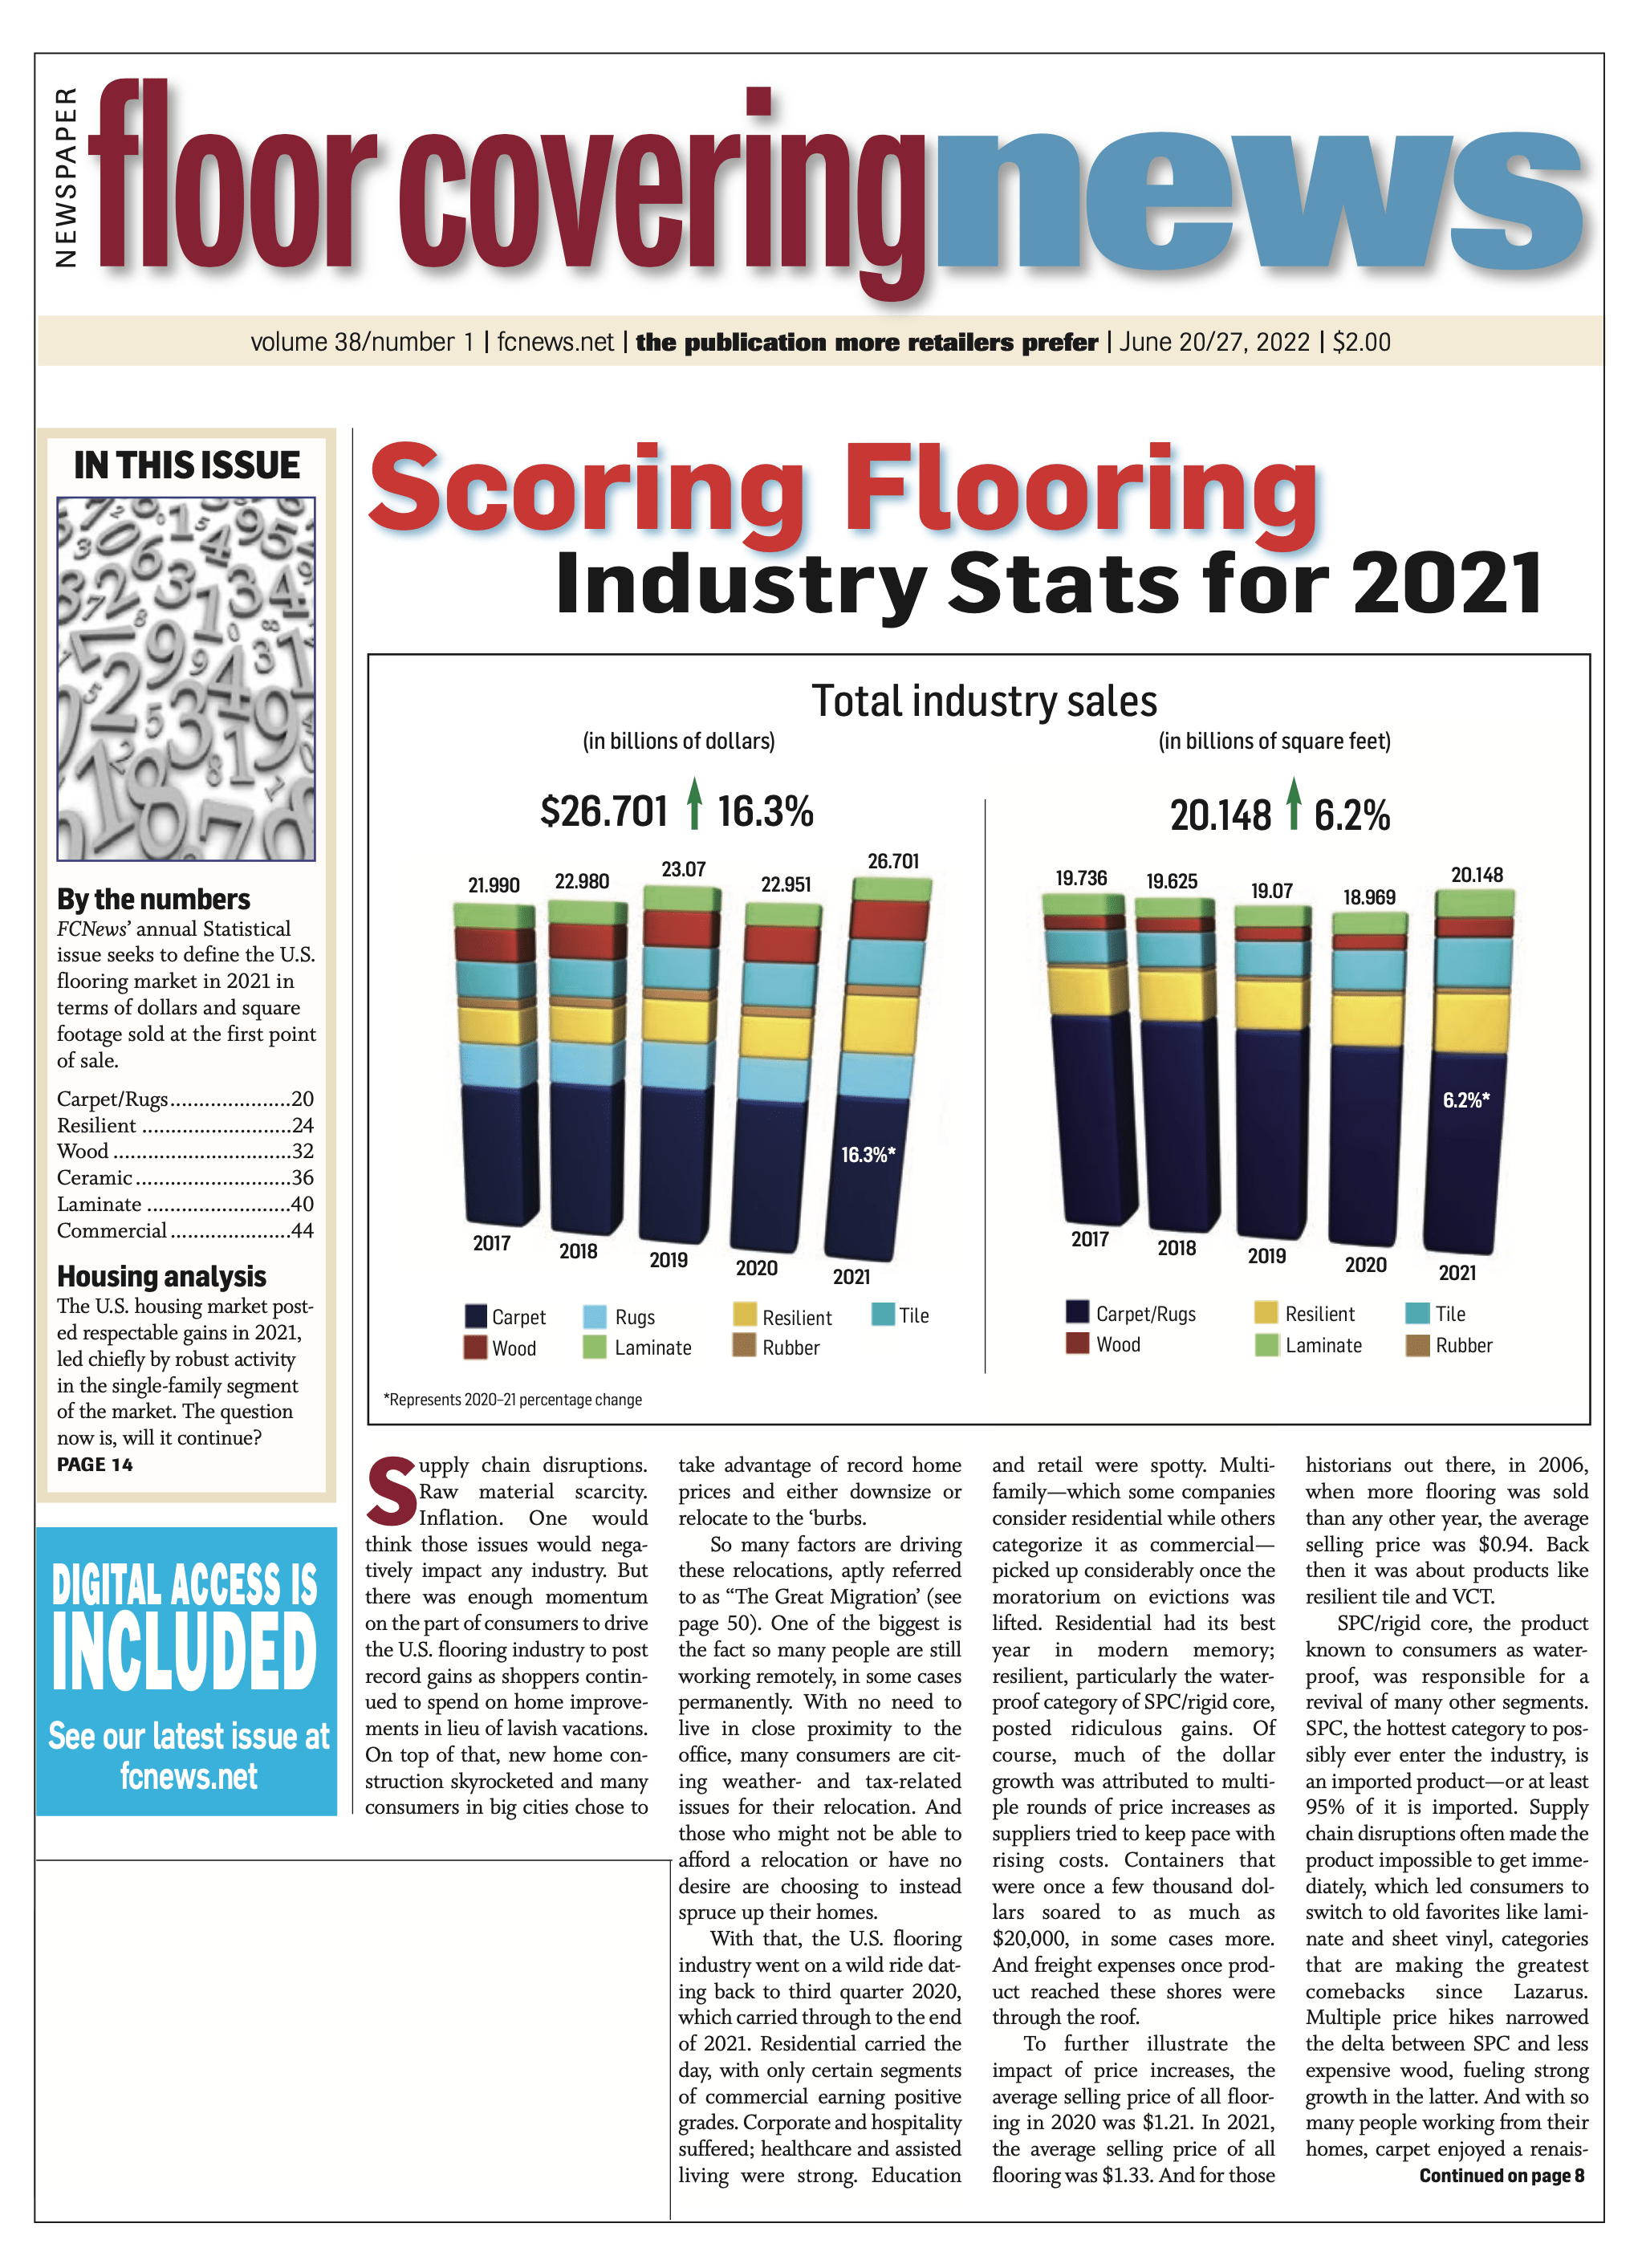
We knew the industry would be up, but how much? And we knew dollar growth would significantly outpace volume growth because of the aforementioned price increases. When the dust settled, our intuition was correct. The industry was up 16.3% in dollars and 6.2% in volume. Never before had the industry eclipsed $26 billion, and you have to go back to 2007 to find a greater number of square feet sold. But back then it was less expensive products like VCT, vinyl sheet, resilient tile and less expensive carpet. The average selling price then was slightly less than a buck. In 2021, it was $1.33.
Unless you’ve been sleeping under a rock for the past few years, you know very well that SPC/rigid core has been leading the charge. Last year, we have total LVT up 31% in dollars and 15.5% in units. But when it comes to SPC, FCNews research reveals that segment up 43% in dollars and 23% in square footage. About 90% of the product comes from Asia, thus making it the segment most impacted by supply chain disruptions. That, coupled with a bevy of price increases, helped fuel growth of other hard surface categories. Laminate (for the most part) and sheet vinyl are domestically manufactured, and in many cases were more readily available. And as prices on SPC skyrocketed, the delta between the latter and lower-end hardwood and ceramic narrowed, making them more attractive options.
After running our numbers through the wash numerous times, we feel confident with total industry growth of 16.3%. Residential carpet was up about 17%; commercial was down. Wood and laminate were up 21% and 7%, respectively. (Laminate would have been up 14% had we not revised last year’s number after new data came to light in the months following the publication of the prior Stats issue.) Residential ceramic was up 11%.
For the skeptics out there, here’s another way to look at things. Take the home centers and mega retailers. Home Depot reported flooring sales of $9.225 billion, up 13.1%, or $1.05 billion. Lowe’s reported flooring sales of $4.95 billion, up 11.4% or $500 million from 2020’s $4.45 billion. Floor & Décor reported sales of $3.43 billion, up 42% over 2020’s $2.425 billion. Those are all retail numbers. Industry insiders tell me those three companies seek to make 35% margin on flooring. Maybe it’s a little higher; maybe it’s a little lower. Either way, it’s close. So just taking into account those three, that’s a gain of $2.5 billion at retail, or $1.6 billion in wholesale dollars. According to our research, that leaves “only” $2 billion for everyone else—specialty retail, Lumber Liquidators, Menards, etc.
One last thing about our results. Resilient is the hardest category to get a handle on. We are confident in our numbers given that about 30 companies reported their confidential numbers to us so everyone could have the most accurate information to benchmark against. Individual companies’ numbers never see the light of day. We asked for each company to break down sales in many ways: residential vs. commercial; sheet vs. LVT/P; felt vs. fiberglass; glue down vs. WPC vs. SPC, etc. Then we estimated the remainder of the industry based on reliable insiders. It’s not an exact science; so many distributors, large retailers and others import on their own. Other companies you probably never heard of private label for distributors and retailers. Two told me they did $50 million last year. And then there’s the lucky company that supplies Home Depot—the business they do with Depot would make your head spin.
Yes, you will see different numbers out there. Some are based on estimates, some are based on government numbers where certain products may be misclassified. We also do not include stone flooring because to this point it’s a hard number to get an accurate read on. We also don’t include ceramic wall tile in our report. But in the end, we believe we have the most accurate numbers you will find anywhere.
Enjoy.